Hidden in Plain Sight
By Helene Ragovin
VIDEO: Remco Chang uses visual analytics to puzzle out secrets from financial fraud to terrorism

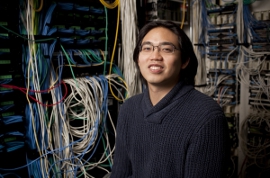
“We’re going through this age of data explosion,” says Remco Chang. Photo: Kelvin Ma
Remember those children’s “hidden picture” puzzles, where the silhouette of a bear is disguised among the fissures of a tree trunk, or the outline of a tea kettle emerges from the folds of a girl’s petticoat?
Computer scientist Remco Chang deciphers puzzles that are infinitely more complicated, but similar in principle. He uses the techniques of visual analytics to uncover information that’s “hidden in plain sight”—information that can tip off bank officials looking for financial fraud, for example, or government investigators tracking terrorist activities. It can also help scientists interpret their lab results, and urban planners tackle growing cities.
In essence, Chang says, the emerging field of visual analysis is a way of sorting through a sea of data to find patterns and outliers that might otherwise have gone undetected.
“We’re going through this age of data explosion,” says Chang, an assistant professor of computer science in the School of Engineering. “Every company, every government agency, is collecting data at a rate that they don’t have time to look at. They don’t know what’s in the data anymore.”
The typical computer science approach is to analyze data by searching for “a pattern that we know we want,” Chang says. “But in this new day and age, in business intelligence, in terrorism activities, in fraud detection, we don’t know what the patterns are—we don’t know what’s in the information; we don’t know patterns we want to find.”
In the video above, Remco Chang describes his work in the visual analysis field. Video: Kelvin Ma
And that’s where the usual approach starts to fall apart. “Computers don’t have the intelligence, the creativity, the ingenuity,” Chang says. “They need humans to tell them what to look for. And if the humans don’t know what to look for, you’re stuck. The essence of the field of visual analytics is helping the user get the gist of what’s in their data and come up with a good hypothesis to explain it.”
For instance, if a series of commercial financial transactions are plotted on a graph, those that are substantially different from the majority—say, between industries that seemingly have no relation to each other—are easier to detect. “If a Chinese car manufacturer is sending money to an American baby-food company, you want to ask what’s going on,” he says.
When you can show large amounts of data pictorially, “you can see where the important information is, and what’s just noise,” Chang says. In other words, visual analytics points out the needle in the haystack.
Identifying the Bad Guys
Chang came to Tufts last semester from the University of North Carolina at Charlotte, where he earned his Ph.D. in computer science. Before receiving his doctorate, he worked in the computer animation industry for several years, and his reasons for leaving such a successful commercial field for academia say a lot about his world view.
“We were making all these video games that were getting flashier and flashier, and I was using all the things I had learned about 3D graphics,” he says. “But I kept wondering: how does this help people? And I never really had a good answer to that.”
So when he discovered the nascent field of visual analytics, Chang saw a way to combine his skills and interests with a socially relevant endeavor.
By its nature, visual analytics is spectacularly interdisciplinary, too. “It’s tied to anybody who ever has had large amounts of data they want to find out more about,” Chang says. He has worked with diverse collaborators, from biologists investigating the biomechanics of how a pig chews to transportation officials and civil engineers looking for ways to manage maintenance of bridges throughout the U.S.
Anti-terrorism efforts have a particularly pressing need to be able to sift through data quickly and thoroughly. Chang is the principal investigator for a project that’s part of the Minerva Initiative, a collaboration between the Department of Defense and university-based social science researchers.
As part of the work, Chang and his team have been analyzing data of all known terrorist activities around the world dating back to the 1970s. That data, in turn, can help answer questions about the development and outcome of conflict and civil strife in general, Chang says. For example, the data has revealed that in the 1990s, terrorist groups worldwide—regardless of their ideology—began to engage in more bombings and fewer kidnappings and assassinations. “Why did they change behaviors?” Chang asks. And can this data yield clues to future terrorist activity?
Chang was also part of a team that worked with a large financial institution to develop better ways of detecting fraud. While there are already automated systems designed to catch known scams, Chang likens the situation to a “Tom and Jerry” cartoon: “The bad guys are always one step ahead. As soon as the system catches one, they try something new, and the computers don’t know what that something new is. It’s like a cat-and-mouse game, and the mouse is always winning,” he says.
And that is where visual analytics fit in. By sorting and depicting the data in different graphical formats, and then being able to interact with that data, human investigators can find clues—digital footprints, so to speak—of previously unnoticed fraudulent activity.
“In this kind of scenario, humans are always—always—smarter than computers,” Chang says. “Our belief is that to beat a human, you need another human; but our humans can have better tools.”
Helene Ragovin can be reached at helene.ragovin@tufts.edu.
